Bonjour, la version française suit la versions anglaise, en rouge.
In this post, I concentrate on those respondents that are called the "Undecideds" or the "Discreet". I also add the possible shifters. I ask whether we can better measure who is really undecided and who may change his/her mind. One may think that the proportion of undecideds should decrease during the campaign. However, it can also increase when events lead people to reconsider their position. Therefore, this information may give a hint of what is happening in a campaign and what may happen on election day.
The usual measure of undecidedness is the fact that a respondent states being undecided. However, as I will show, this measure is not that reliable. Therefore, I look at two other measures; the first is the part of voting intentions for each party that is due to "leaners". The second is whether the respondent says that she may change her mind or is not certain of her vote.
Dans ce message, je me concentre sur les répondants que l'on appelle les indécis ou les "discrets". J'ajoute également les possibles transfuges. Je me demande si on peut mieux mesurer qui est vraiment indécis et qui peut changer d'idée. On peut penser que la proportion d'indécis devrait normalement diminuer pendant les campagnes électorales. Toutefois, cette proportion peut aussi augmenter suite à des événements qui peuvent amener l'électeur à questionner ses choix. Par conséquent, cette information peut nous donner des indications sur ce qui se passe et ce qui peut arriver le jour de l'élection.
La mesure habituelle de l'indécision est la déclaration du répondant qui se dit indécis. Toutefois, cette mesure n'est pas très fiable comme je le montre plus loin. Par conséquent, j'analyse deux autres mesures soit la proportion des appuis à chaque parti qui est due aux répondants qui révèlent leur préférence uniquement à la question de relance et le fait de révéler pouvoir changer d'avis ou être incertain de son vote.
Undecidedness
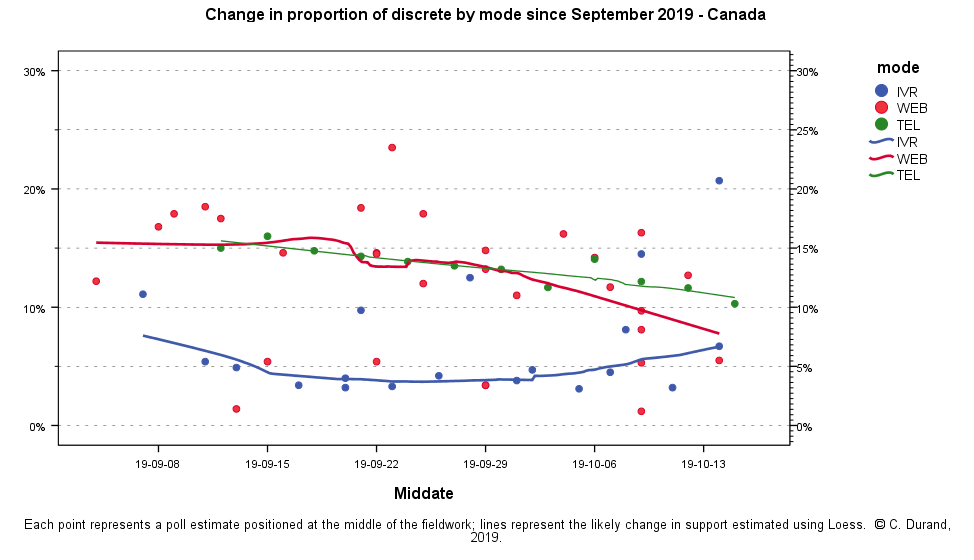
One problem with using stated undecidedness is that it varies much between modes of administration and even between pollsters using the same mode of administration. As we can see in the following graph, IVR (Interactive Voice Response) polls tend to have much lower proportions of undecideds. On the opposite, both Web and telephone polls have a higher proportion but this proportion has decreased on average since the beginning of the campaign. However, among the IVR pollsters, EKOS has a much higher proportion of undecideds, and among web pollsters, Angus Reid has a proportion of undecideds similar to IVR polls. Therefore, we may conclude that this measure in more an indication of the methodology used by the pollster than of the real proportion of undecideds.
L'indécision
Le principal problème avec la mesure traditionnelle de l'indécision est le fait qu'elle varie beaucoup selon les modes d'administration et même entre les sondeurs utilisant le même mode d'administration. Comme on le voit dans le graphique, les sondages faits par téléphone automatisé (IVR) ont généralement des taux d'indécis plus bas que les sondages Web ou téléphoniques. Par ailleurs, la firme EKOS a des taux d'indécis plus élevés que les autres sondages IVR alors que Angus Reid a des taux plus bas que les autres sondages WEB. On peut donc conclure que la mesure traditionnelle de l'indécision donne moins une indication de la proportion réelle d'indécis que de la méthodologie utilisée par le sondeur.
In view of this situation, we turn to another possible indicator of undecidedness. Ipsos, like most other pollsters, ask the vote intention question in "two parts". It asks all respondents who say they don't know which party they will vote for whether they are leaning towards a specific party. Around 35% to 45% of undecideds to the first question give a preference when asked this second question. Ipsos provided us with their tables for the two questions. We computed the proportion of the vote intention that comes from leaners for each party and each poll since the beginning of September. The following table shows the results.
Devant cette situation, nous nous tournons vers un autre indicateur de l'indécision. Ipsos, comme la plupart des sondeurs, demande la question d'intention de vote en "deux parties". On demande aux personnes qui disent ne pas savoir pour qui elles vont voter si elles "penchent vers un parti". Cette question est appelée la question de relance. De 35% à 45% des indécis à la première question révèlent une intention de vote à la question de relance. Ipsos nous a gracieusement fourni ses tableaux détaillés. Nous avons calculé la proportion des électeurs de chaque parti qui provenait de personnes ayant répondu à la question de relance.
The graph shows that the proportion of leaners is lower for Conservatives, who tend to state their preference outright. On the opposite, both the LPC and the BQ had higher proportions of leaners at the beginning of the campaign. The proportion of LPC leaners went down to even lower than Conservatives while the proportion of BQ leaners increased and then decreased to the same level as the Conservatives. Meanwhile, the proportion of NDP leaners increased. The difference between parties is not large but this information may say something about what will happen on Election day. Will the polls overestimate parties with a higher proportion of leaners? Or is the proportion of leaners an indication of a move towards a party that will show on Election Day?
Le graphique montre que la proportion de répondants provenant de la question de relance est moins élevée chez les partisans du PCC. Ces derniers tendent à révéler leur intention de vote dès le départ. À l'opposé, une plus grande proportion des partisans du PLC et du Bloc provenait de répondants à la question de relance au début de la campagne. Cette proportion a diminué chez les partisans du PLC alors que du côté du Bloc, elle a d'abord augmenté pour ensuite diminuer. Enfin, la proportion des répondants provenant de la question de relance a augmenté chez les partisans du NPD. Les proportions selon les partis ne sont pas très différentes mais ceci peut donner des indications sur ce qui peut se passer le jour de l'élection. Est-ce que les sondages surestimeront les partis dont une plus grande proportion des appuis vient de la question de relance? Ou au contraire, cette proportion indique-t-elle qu'il y a un mouvement vers un parti qui se matérialisera le jour de l'élection?

And what about possible shifters?
Both my research with André Blais for the Quebec 2018 election and the CES 2004 data show that polling misses may sometimes be explained by people changing minds disproportionately towards one party. Ipsos asks respondents who state a preference whether they are very certain, fairly certain, not very certain or not at all certain of their choice. Léger has a different question. The pollster asks whether the respondent's choice is final or whether it may change (a don't know option is also presented).
Qu'en est -il des possibles transfuges?
Tant ma recherche avec André Blais sur les sondages de l'élection québécoise de 2018 que les données de l'Enquête électorale canadienne de 2004 montrent que les erreurs des sondages peuvent parfois s'expliquer par le fait que des électeurs changent d'avis de façon disproportionnée en faveur d'un parti. Ipsos demande aux répondants jusqu'à quel point ils sont certains de leur choix. Léger quant à lui demande si le choix est définitif ou s'il peut changer. La possibilité de dire qu'on ne sait pas est également offerte.
Are you certain?
The following graph shows the proportion of respondents who were not very or not at all certain of their choice for the polls in which the question was asked, by party, since mid-August. It shows that first, the proportion of not certain respondents has decreased since August and second, this proportion is lower for Conservative voters and higher for the Greens. However, like the proportion of leaners, it decreased for Liberal voters and it increased and then decreased among Bloc supporters. For the NDP, the proportion has decreased, in this case unlike the proportion of leaners.
Êtes-vous certain?
Le graphique suivant montre la proportion de répondants qui ont dit ne pas être beaucoup ou pas du tout certains de leur choix, par parti politique depuis la mi-août. Il montre d'abord que la proportion de répondants "non certains" a diminué depuis août, surtout plus récemment. Cette proportion est par ailleurs plus basse pour les Conservateurs et plus élevée pour les Verts. Toutefois, tout comme la proportion de répondants provenant de la question de relance, cette proportion a diminué chez les supporteurs du PLC et elle a augmenté puis diminué chez les partisans du Bloc. Pour le NPD, la proportion a diminué, contrairement dans ce cas à la proportion provenant de la relance.

May you change?
We can compare these results with Léger's answers to the question about the possibility of changing minds. We group together those who say they may change and those who say they do not know because these two proportions tend to be related. The proportion of "may change and don't know" is higher than the proportion of "not certain" but the conclusions are quite similar. The proportion of possible shifters has slightly decreased during the campaign and it is generally lower for the partisans of the main parties. The proportion of possible shifters amond NPDers has slightly decreased. The proportion of possible shifters among Bloc supporters has been lower than that of the NDP from the beginning and it has increased and then decreased to reach a level similar to the main national parties. This result is confirmed by the last Léger conducted in Quebec only.
Pouvez-vous changer?
Nous pouvons comparer les résultats précédents à ceux fournis par Léger à la question relative à la possibilité de changer d'idée. Nous avons regroupé les répondants qui disaient pouvoir changer et ceux qui disaient ne pas savoir si leur choix était définitif. La proportion de ces deux catégories groupées est plus élevée que celle des "non certains" de IPSOS mais les conclusions sont similaires. La proportion de possibles transfuges a légèrement diminué au cours de la campagne et elle est généralement plus basse chez les partisans des deux principaux partis. La proportion de possibles transfuges a légèrement diminué chez les partisans du NPD. Chez les partisans du Bloc, cette proportion était plus basse que pour le NPD au départ et elle a augmenté puis diminué pour se retrouver au même niveau que celle des partis principaux, ce qui est confirmé par le dernier sondage Léger réalisé au Québec seulement.

Does it tell us something about Election day results? We have the same data from Léger in 2015. The proprotion at that time was higher than in 2019. The following graph helps us interpret what this question means. In short, in 2015, an election characterized by movement between the NDP and the LPC until the end of the campaign.
the following graph shows that the proportion of possible shifters is similar for the LPC and NDP supporters during the whole campaign. We may tentatively conclude that this proportion is indicative of possible movements between parties.
Est-ce que ces informations nous donnent une idée sur ce qui risque de se passer le jour des élections? Le graphique suivant aide à interpréter ce que signifie cette question. En 2015, la proportion était plus élevée qu'en 2019. En résumé, en 2015, une élection caractérisée par des mouvements entre le NPD et le PLC jusqu'à la fin de la campagne, le graphique suivant montre que la proportion de possibles transfuges est demeurée similaire pour les partisans du PLC et du NPD tout au long de la campagne. On pourrait conclure que cette proportion de possibles transfuges est un bon indicateur des mouvements possibles entre les partis.

We cannot know whether these measures of undecidedness and possible shifts are really informative of what may happen on Election day. However, it is a complement to the usual information about the proportion of "undecideds" to the vote intention question. One conclusion is that Conservatives are more likely to be decided and seem to have nowhere to go. This is confirmed by the question on the second choice asked by Leger in its October 7-8 poll. The CPC supporters are the less likely to say they have a second choice. Liberals' second choice is clearly the NDP. NPD supporters' second choice is split between the LPC and the Greens. The Greens' second choice is the NDP and almost nobody has the Bloc as a second choice. Unfortunately, this question is not present in the last Léger poll conducted only in Quebec. It stays that at the national level, the Léger poll shows that the NDP is the most important "second party" (25%) followed by the Greens (16%) and the LPC (13%).
I wish to thank Luis Peña Ibarra for his assistance with all the analyses and compilation of results in this election. I also wish to thank IPSOS (Sébastien Dallaire) who provided me with tables that are not normally public. I also thank Léger (Christian Bourque) for providing me with the 2015 Léger reports.
En conclusion, nous ne pouvons pas encore dire si ces nouvelles mesures d'indécision et de possibles mouvements nous informent de ce qui se passera le jour de l'élection. Toutefois, ces mesures sont un bon complément à l'information sur la traditionnelle proportion d'indécis. Une conclusion à tirer est que les Conservateurs sont plus souvent décidés mais semblent avoir nulle part où aller. Ceci est confirmé par les résultats de la question sur le deuxième choix posée par Léger dans son sondage du 7-8 octobre. Les partisans du PCC sont les moins susceptibles d'avoir un deuxième choix. Le deuxième choix des Libéraux est clairement le NPD. Les partisans du NPD privilégient les Libéraux et les Verts dans la même proportion. Presque personne n'a le Bloc comme second choix. Malheureusement, le dernier sondage Léger réalisé au Québec seulement ne présente pas cette question. Il demeure qu'au niveau national, le NPD est le plus important deuxième choix (25%) suivi des Verts (16%) et du PLC (9%).
Je tiens à remercier Luis Peña Ibarra pour son assistance dans l'ensemble des analyses portant sur cette campagne électorale. Je tiens également à remercier Ipsos (Sébastien Dallaire) pour leur précieuse collaboration et entre autres pour m'avoir fourni des tableaux qui n'étaient pas normalement publiés. Enfin, je tiens également à remercier la firme Léger (Christian Bourque) qui m'a fourni les rapports Léger de 2015.


