Translate

jeudi 17 juillet 2014

Scottish Independence & the Young people

 Hi,

The question of young people's vote is interesting sociologically and politically. We expect young people to be more favorable to the Yes side in a referendum on independence because it proposes change. Young people may be more interested in change than in status quo. They may also be more easily convinced since they have not yet made up their mind definitely on many political issues. On the other hand, young people are accustomed to live in a globalized world. We may expect them not to be that interested in national States.

So what happens? I present first the situation in Scotland and then compare it with what happened and is now happening in Quebec regarding support for sovereignty among young people.

Scotland

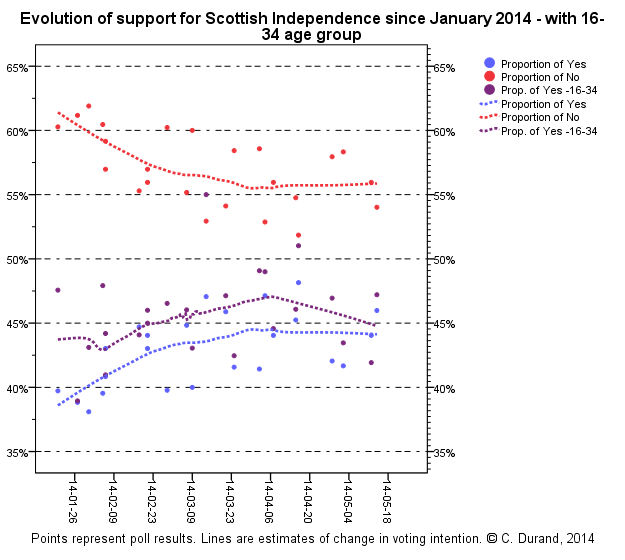
The following graph shows support for independence from January 2014 to the most recent polls among the whole population and among the 16 to 34 years old (purple line ). I computed a weighted average of the results by age group (age group by sex for Panelbase) presented by the different firms in order to arrive at a combined 16-34 age group*.

The graph shows that support for independence is slightly higher among the 16-34 age group than among the general population. However, the difference is rather stable.


Quebec

The following graph shows the change in support for sovereignty for the three age groups between 1979, just before the first referendum in 1980, and 2014. The analysis is restricted to French-speaking Quebeckers -- usually defined as persons who speak mostly French at home -- since non-French speaking Quebeckers were generally opposed to sovereignty whatever their age.


The graph shows that before the first referendum in 1980, support for sovereignty among the 18-34 age group (47% of the population at that time) stand out compared to support among the two other age groups. It is at 63 percent compared to 36 percent for the 35-54 age group and 22 percent for the 55+ age group. The young people who were favorable to sovereignty in 1980 were still favorable in 1995 -- they constitute most of the 35-54 age group -- and they were joined by the new young people so that both the 18-34 and the 35-54 age groups were very favorable to sovereignty, at more than 63%, while support among the 55+ age group was at 40%.

This gave rise to the "dying federalist hypothesis" which stated that, as older people die, if  young people are still be more sovereigntist than older people and stay so as they grow older, sovereignty will eventually -- mathematically -- get the support of the majority of the population. This is not what happened. As we can see, after 2010, there is no more difference in support for sovereignty according to age which means that a) young people are not more sovereignist than the elder anymore and b) people do not necessarily stay sovereignist all their life. They may change their mind at some point.

In a presentation at IRPP in 2001, I also showed that only the less than 55 years old were influenced by the campaign in 1995. Support among those who were 55 years and older remained stable.

Another way to look at support for sovereignty according to age is illustrated by the following graph. The two upper lines -- blue for the 18-34, green for the 35-54 -- show that support for sovereignty increased among all French speakers after the 1995 referendum where the Yes side was defeated 50.5% to 49.5%. It started to decline around 2002, went up a bit around the Sponsorship scandal in 2004-2005, and finally went on declining. The point is that it declined more among the younger age groups than among the 55+ age group so that, in 2014, there is no difference left between the age groups.


Conclusion

The situation in Scotland seems closer to the actual situation in Quebec than to the situation that prevailed in Quebec on the eve of the two referendums. Support for independence does not differ much between age groups and it changes similarly among the young people than among the general population. The hypothesis that young people do not differ much from older people in their political positions is the most plausible for now. 


* Methodological note: Sample sizes of smaller age groups -- 16-24, 25-34 -- were way too small to use the results with some confidence. These results vary enormously from one poll to the next and from one age group to the next. In addition, there were some differences in the age groups used by the different firms. I computed a weighted average of the support of the 16-24 and 25-34 age groups. For YouGov -- who uses a 25-39 age group -- I considered it to be an estimate of the support among the 25-34 age group and I applied the same weights as for the other firms. For Panelbase, who presents results for males 16-34 and females 16-34, I used a weight according to sex.
mercredi 9 juillet 2014

Scottish Independence, Quebec Sovereignty, similar or not?

Hi,

First, my apologies to French-Speaking followers since I am going to write my messages on the Scottish referendum solely in English. And apologies to English speakers too: My English writing is not perfect.

The referendum campaign for Scottish independence is under way. It is the first time where it is possible to compare a political campaign with the referendum campaign pertaining to Quebec sovereignty in 1995. The Quebec referendum was held on October 31th 1995 and ended with a very close result, i.e. 50.5% No and 49.5% Yes. The turnout was 93.5%. In both situations, the movement for Independence is taking place in a developed country that is part of the Commonwealth.

For this first post, I will compare the Scottish polls with the Quebec polls during similar periods and I will address the question of attribution of preferences to non disclosers, i.e. respondents who do not reveal a preference or state that they will not vote. In following posts, I will address the question of whether there are differences between polls' estimates according to the methodology used --  mode of administration, question wording, etc. -- and I will deal with the question of whether young people's preferences differ from older people's.

What is the state of public opinion? 

a) Including non disclosers


The following graph shows the evolution of support for Scottish Independence. The non-disclosers -- all those who say they don't know how they will vote or state that they and will not vote -- are  included in the graph.


It shows that although there was a possible increase in support for Independence from January to March, support seems to be going back to what it was at the beginning of the year. In addition, we see that there is much variation between the estimates from the different pollsters. The proportion of Yes is at about 35% but it varies between less than 30% and close to 43%. The proportion of No is close to 50% on average but the range of estimates is also large, i.e. 10 points. Finally, the proportion of non disclosers stays between 10% and 20% except for some specific polls where it reaches 30% or more. Those polls were generally conducted face-to-face.

If we look at a similar period in Quebec, i.e. January to June 1995 -- the referendum was to be held on October 30th -- we get a quite different portrait. Notice that since the question wording had not been decided yet at that time in Quebec, pollsters used different wordings and tested support for different options and according to different wordings. In order to have enough data as well as a relatively homogenous information, I kept the estimates for all the questions pertaining to a vote for either sovereignty per se or sovereignty with an association with the rest of Canada. Here is the portrait:


In the Quebec situation, we notice first that the Yes and No sides were closer than it is in Scotland and second, that the proportion of non-disclosers decreased in the last weeks before summer with a concurrent increase in both Yes and No support.

b) A few words about the non-disclosers

Is there a relationship between the proportion of non-disclosers in the polls and the distribution of Yes and No? The clear answer is that for these periods, there is absolutely no significant  relationship between the proportion of non-disclosers and the distribution of support for Yes and No in Scotland as well as in Quebec. In Quebec however,  following suggestions from researchers -- Maurice Pinard, Pierre Drouilly -- based on empirical findings, there has been a tendency to attribute more non-disclosers to the No side -- between 67% and 75% -- than to the Yes side. The rationale for this practice was that the socio-demographic profile of the non-disclosers is more similar to the profile of No voters -- more likely to be older, for example -- than of Yes voters. This practice allowed for a very good estimate of the referendum results in 1995. Without it, the predictions would not have been accurate.

Should Scottish pollsters proceed to a non proportional attribution of non-disclosers? This question should be examined. In any case, it is highly possible that the No side is underestimated since when polls are not accurate, it is usually the status quo side, the more conservative side of the electorate, that is underestimated.

c) Excluding non-disclosers, with proportional attribution

If we exclude the non-disclosers, we have to decide how to attribute them between Yes and No. The common use is to do it proportionally. The hypothesis here is that the preferences of those who do not reveal a preference are similar to to the preferences of those who do reveal them. Notice however that this means that when the proportion of No is close to 60%, proportional attribution gives to the No side a proportion that is close to the non proportional distribution that was used in Quebec. In short, non proportional attribution has a more substantial effect when the distribution of Yes/No is close to 50%.

Here is the portrait of the evolution of support for Independence in Scotland with proportional attribution of non-disclosers:


 It shows the No  side between 55% and 60% with the difference between Yes and No being close to 15%, and no overlap of Yes and No, whatever the poll.

Now, let's see what was the situation in Quebec at about the same period with a similar proportional attribution of non disclosers.  The graph shows that at most, there was a 10 point gap between Yes and No around the middle of March. By May, the gap had closed and, by the end of June, the difference between Yes and No was 5 to 6 points .


Conclusion:

In Quebec as in Scotland, the campaign started with a deficit for the Yes side. However, the deficit was clearly less substantial in Quebec than it is right now in Scotland. Campaign dynamics vary within and between countries. It will be interesting to follow the Scottish situation and examine the methodological questions that it will raise. Will opt-in panels -- more than two-thirds of the polls -- overestimate the Yes side? Will polls in general be accurate using a proportional attribution of non disclosers? How will young people vote? Will they be much more favorable to Independence like in 1995 in Quebec or will they have similar preferences as the other age groups, like the current situation in Quebec?


P.S. Methodological information for specialists: The lines -- the likely evolution -- are estimated  using weighted local regression (loess) with Epanechnikov estimation using 65% of the points for adjustment. In various trial and error with different "smoothers", it appeared the best ans most flexible compromise and it gave very good results in the last Quebec election in 2014.