The question of young people's vote is interesting sociologically and politically. We expect young people to be more favorable to the Yes side in a referendum on independence because it proposes change. Young people may be more interested in change than in status quo. They may also be more easily convinced since they have not yet made up their mind definitely on many political issues. On the other hand, young people are accustomed to live in a globalized world. We may expect them not to be that interested in national States.
So what happens? I present first the situation in Scotland and then compare it with what happened and is now happening in Quebec regarding support for sovereignty among young people.
Scotland
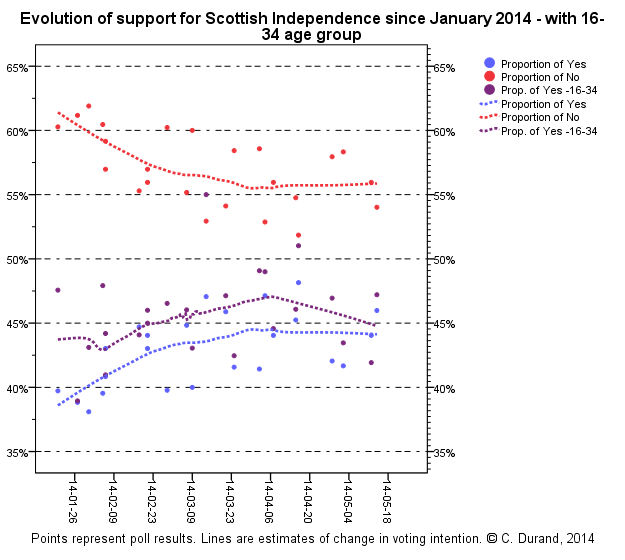
The following graph shows support for independence from January 2014 to the most recent polls among the whole population and among the 16 to 34 years old (purple line ). I computed a weighted average of the results by age group (age group by sex for Panelbase) presented by the different firms in order to arrive at a combined 16-34 age group*.
The graph shows that support for independence is slightly higher among the 16-34 age group than among the general population. However, the difference is rather stable.
Quebec
The following graph shows the change in support for sovereignty for the three age groups between 1979, just before the first referendum in 1980, and 2014. The analysis is restricted to French-speaking Quebeckers -- usually defined as persons who speak mostly French at home -- since non-French speaking Quebeckers were generally opposed to sovereignty whatever their age.

The graph shows that before the first referendum in 1980, support for sovereignty among the 18-34 age group (47% of the population at that time) stand out compared to support among the two other age groups. It is at 63 percent compared to 36 percent for the 35-54 age group and 22 percent for the 55+ age group. The young people who were favorable to sovereignty in 1980 were still favorable in 1995 -- they constitute most of the 35-54 age group -- and they were joined by the new young people so that both the 18-34 and the 35-54 age groups were very favorable to sovereignty, at more than 63%, while support among the 55+ age group was at 40%.
This gave rise to the "dying federalist hypothesis" which stated that, as older people die, if young people are still be more sovereigntist than older people and stay so as they grow older, sovereignty will eventually -- mathematically -- get the support of the majority of the population. This is not what happened. As we can see, after 2010, there is no more difference in support for sovereignty according to age which means that a) young people are not more sovereignist than the elder anymore and b) people do not necessarily stay sovereignist all their life. They may change their mind at some point.
In a presentation at IRPP in 2001, I also showed that only the less than 55 years old were influenced by the campaign in 1995. Support among those who were 55 years and older remained stable.
Another way to look at support for sovereignty according to age is illustrated by the following graph. The two upper lines -- blue for the 18-34, green for the 35-54 -- show that support for sovereignty increased among all French speakers after the 1995 referendum where the Yes side was defeated 50.5% to 49.5%. It started to decline around 2002, went up a bit around the Sponsorship scandal in 2004-2005, and finally went on declining. The point is that it declined more among the younger age groups than among the 55+ age group so that, in 2014, there is no difference left between the age groups.

Conclusion
The situation in Scotland seems closer to the actual situation in Quebec than to the situation that prevailed in Quebec on the eve of the two referendums. Support for independence does not differ much between age groups and it changes similarly among the young people than among the general population. The hypothesis that young people do not differ much from older people in their political positions is the most plausible for now.
* Methodological note: Sample sizes of smaller age groups -- 16-24, 25-34 -- were way too small to use the results with some confidence. These results vary enormously from one poll to the next and from one age group to the next. In addition, there were some differences in the age groups used by the different firms. I computed a weighted average of the support of the 16-24 and 25-34 age groups. For YouGov -- who uses a 25-39 age group -- I considered it to be an estimate of the support among the 25-34 age group and I applied the same weights as for the other firms. For Panelbase, who presents results for males 16-34 and females 16-34, I used a weight according to sex.
Aucun commentaire:
Publier un commentaire